- Observability 360
- Posts
- Datadog's Trillion-event Engine
Datadog's Trillion-event Engine
The Agentic Takeover | Logging Reinvented

Welcome to Edition #40 of the newsletter!
Welcome to the first Observability 360 newsletter of 2026. It is customary to welcome the new year in a spirit of optimism and confidence. Although the observability space itself seems to be as vibrant and dynamic as ever, this is against a background of global uncertainty and almost unfathomable opportunities and risks presented by the AI revolution.
Uncertainty seems to be the only certainty. The flip side of this is that the future is unwritten, and we look forward to collaborating with the observability community as the narrative of 2026 unfolds.
Feedback
We love to hear your feedback. Let us know how we are doing at:
NEWS
LogicMonitor Swoop for Catchpoint

Full stack heavyweights LogicMonitor rounded off 2025 by making a major statement with their acquisition of Catchpoint - a leading vendor in the IPM (Internet Performance Monitoring) sector.
Over the past few years, vendors have been broadening their offerings in a number of directions, and IPM is an important concern for SREs and observability engineers, especially in companies with a global presence. In almost every vendor survey, ‘tool sprawl’ is cited as a concern amongst observability teams and managers. In this context, consolidating tooling such as IPM into the vendor stack is a logical move.
According to the announcement on BusinessWire, the acquisition will enable teams to shift to a more proactive footing and eliminate blind spots.
Bindplane Roll Out “pipeline intelligence”

Bindplane have established themselves as one of the major players in the pipelining space, with their highly scalable, open-source control plane. They have now radically upgraded their product with the release of their “Pipeline Intelligence” platform.
The primary value proposition of telemetry pipelines has generally resided in functions for telemetry filtering and control flow. Pipeline Intelligence raises the bar with new AI-powered features designed to minimise the toil involved in building parsers for new data sources. Bindplane estimate that this can reduce the configuration workload by 70-80%, therefore freeing engineers for more productive tasks.
Observe’s Snowflake Homecoming

Late last year Palo Alto Networks made waves with their surprise acquisition of Chronosphere, and now 2026 has kicked off with news that Observe have been acquired by database giants Snowflake. The vibe from the Observe camp is that this is not a case of an outsider shopping around for an Observability bauble to add to their tech portfolio.
In fact, there was already a close working relationship between the two companies. Snowflake is not only the backend database powering Observe’s datalake architecture, they have also been a long-time investor in the company. Given the closeness of the pre-existing relationship, Observe have described the move as "coming home".
For customers, it will be business as usual. This will not be a case of Observe being swallowed up or losing its identity. Theoretically, aligning the resources of the two companies should result not just in economies of scale but also produce synergies in AI and data processing capabilities.
You can read Observe CEO Jeremy Burton’s announcement of the acquisition in this post on LinkedIn.
Unlocking API Insights with Treblle

An API can take many forms. It might be just a local microservice that generates cat memes or gives your position in the company fantasy football league. It may also be a public gateway filtering and relaying millions or billions of requests to backend services.
In the latter case, you may be interested in Treblle’s Anatomy of the API report. For Treblle, the API is the “interface to business operations” and presents its own specific challenges around security, reliability and performance.
We thought we knew about APIs, but this report schooled us with insights into the Ashburnum Phenomenon and the 322 Millisecond Barrier. In addition, there is also solid coverage of enduring API concerns such as versioning, identity and the threat landscape.
The report is free to download, but registration is required.
Products
Grafana Roll Out Mimir 3.0

Grafana launched Mimir back in 2022 with the modest aim of making it the most scalable metrics backend on the planet, aiming to ramp up to “a billion metrics and beyond”. Version 3.0 of the product has now been rolled out, and it ships with a number of architectural improvements designed to propel it towards that target. To reinforce the system’s processing capabilities, the Kafka messaging platform has now been incorporated into the Mimir ingestion pipeline.
Other major improvements include Ingest Storage and a new querying engine. The previous, PromQL-based incarnation has been swapped out for a new version which improves performance by streaming the response rather than waiting until all data has been loaded into memory.
Mermin - Unified K8S Observability

Mermin may sound like a popular Finnish cartoon character, but it is in fact an open source K8S observability tool developed by Elastiflow.
Why do we need yet another K8S observability tool? Well, according to Elastiflow, most existing tools are either APM-based - monitoring application characteristics or NPM-based, monitoring network flows. This results in a partial and fragmented view of K8S.
The aim of Mermin is to overcome this disconnect so that, for example, lags in microservice performance can be mapped to specific network latency issues. The glue that binds this all together is, of course OpenTelemetry - using the semantic conventions for capturing network flows.
The system is eBPF-powered, so no code changes are required to get up and running. At the moment, the system is in beta and is open for new signups. The prospect of spending an hour or two drooling over those beautiful chord diagrams may be too hard to resist.
Architecture
Inside Datadog’s Trillion-Event Engine

Datadog may be the pantomime villain of observability, but they pull off some heavy-duty feats of engineering and they post some highly informative deep dives on their blog. In this article, Sami Habet digs into the internals of Husky, Datadog’s backend data store, which processes more than 100 trillion events each day.
As the article points out, these days systems need to do more than just ingest and store huge volumes of telemetry - more and more customers are demanding interactive querying at scale. Delivering performant querying over millions of files and petabytes of data is a major engineering challenge, and this is a fascinating journey into Husky’s internals, covering exotic design constructs such as predicate caches, operator chaining and zone-map pruning.
Many vendors jealously guard the secrets of their backend architecture, so this is a rare opportunity to take a peek in to the machinery that powers an observability behemoth.
AI
Welcome to the Agentic Takeover

The agentic takeover continues apace, with Observe, Coralogix and Dash0 all recently unveiling Agentic AIs designed to reduce toil, automate processes and democratise querying. These are agents embedded in their respective stacks, as opposed to standalone SRE AIs such as Cleric or Resolve. One of the major differences between the two modes lies in the area of User Experience. Whereas standalone agents tend to be headless, communicating via channels such as Slack, the embedded agents tend to be more expansive and tactile.
Equally, while AI SREs tend to be incident-oriented, embedded agents are more attuned to ad hoc querying and exploration. Coralogix, for example, claim that their Olly agent "makes observability useful across technical and non-technical teams alike". Observe's Olly has a similar scope, with the added benefit of being able to query the Observe Object Graph.
Dash0 have taken a different approach to other vendors. Instead of a single all-purpose agent, Agent0 is the name for a family of five agents, each with their own specialism such as troubleshooting, crafting PromQL queries and analysing traces.
Elastic Streams - Logs May Never Be The Same Again

And next - an AI story that’s not about agents. Elastic have a long history as a log aggregation provider. As they note in this article though - logs have become rather unfashionable of late, not quite being able to boast the svelte composability of traces.
Well, with the release of Streams, Elastic are aiming to flip that narrative as they attempt to position logs as the premier signal for troubleshooting. The gist of their argument is that metrics are the “what” and traces are the “where”, but logs are the “why” - and as such provide the strongest leads for root cause analysis.
In practice, this means that the Streams pipeline is capable of ingesting raw logs at scale and then using AI for dynamic parsing and identification of exceptions and anomalies. For SREs this mitigates the toil of writing custom parsing rules and eliminates noise.
OpenTelemetry
Getting expressive with Declarative Configuration

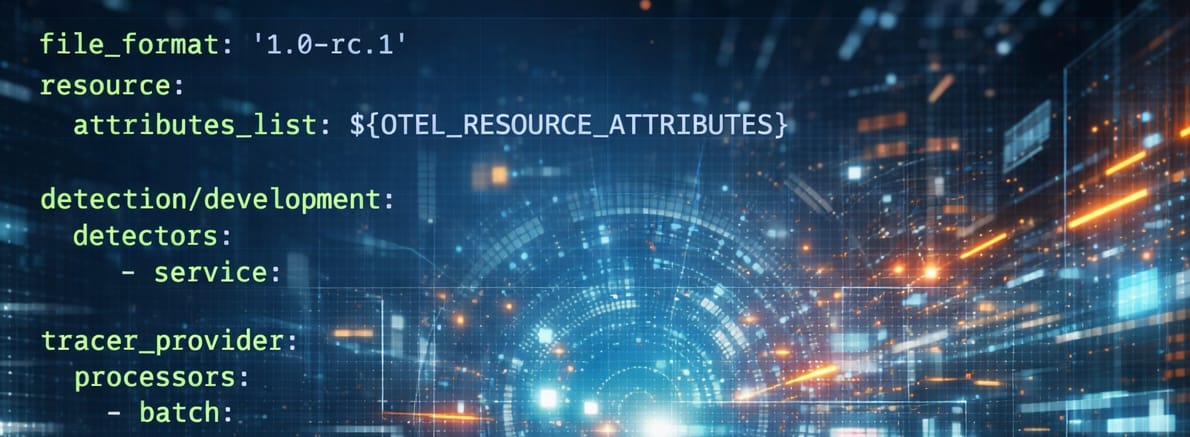
One of the longest-standing requests on the OpenTelemetry backlog - declarative configuration, has finally been committed into the codebase. Previously, configuration was limited to passing in environment variables to your application’s context.
Whilst this works for defining simple values such as the URL of an endpoint, it falls down when configuration depends on conditional or structured logic.
Declarative Configuration means that advanced configuration logic can now be defined in a YAML file, whose path can be passed as an environment variable. Declarative Configuration is also language-neutral, so the same file can be used whether your application is running in Java, JavaScript or Go.
You can find out more about creating Declarative Configuration in this excellent article on the Last9 blog. If you’re wondering how could it take five years to develop this feature, check this article on the OpenTelemetry blog.
Social Media

After the Observability 360 newsletter, the second best place to find out what’s happening in observability is on social media. Don’t worry - we have done all the doom-scrolling for you! Here are some of our picks from the last few weeks.
We start off with this head-spinning account of agility and resilience from Deductive. At 4pm on December 15 of last year, Datadog, their observability provider, informed them that they were pulling the plug on their account. In under 48 hours they had migrated their observability estate lock, stock and barrel to Grafana. If you are thinking that oTel was the magic ingredient that enabled this level of velocity, think again…
You may have noticed that an increasing number of vendors in the observability space are recruiting for Forward Deployed Engineers. It sounds like a kind of tactical military unit, but it is actually a role that has been imported from AI startups. This thread on Reddit highlights the strategic importance of the role in preventing customer churn.
The observability cost crisis has been a huge talking point over the last few years, but it is not the only field where users are being impaled on cost spikes. This is a howl of pain from a Reddit user reacting to an Anthropic costs blowout.
That’s all for this edition!
If you have friends or colleagues who may be interested in subscribing to the newsletter, then please share this link!
This week’s quote is from Sami Tabet of Datadog:
“The fastest query is the one you don’t have to run.”
About Observability 360
Hi! I’m John Hayes - I’m an observability specialist. As well as publishing the Observability 360 newsletter, I am also an Observability Advocate at SquaredUp.
The Observability 360 newsletter is an entirely autonomous and independent entity. All opinions expressed in the newsletter are my own.