- Observability 360
- Posts
- Introducing The Observability Cosmos
Introducing The Observability Cosmos
How Skyscanner Do oTel | Mezmo's Aura Framework
John Hayes
April 24, 2026
Welcome to Edition #46 of the Newsletter!
Introducing the Observability Cosmos
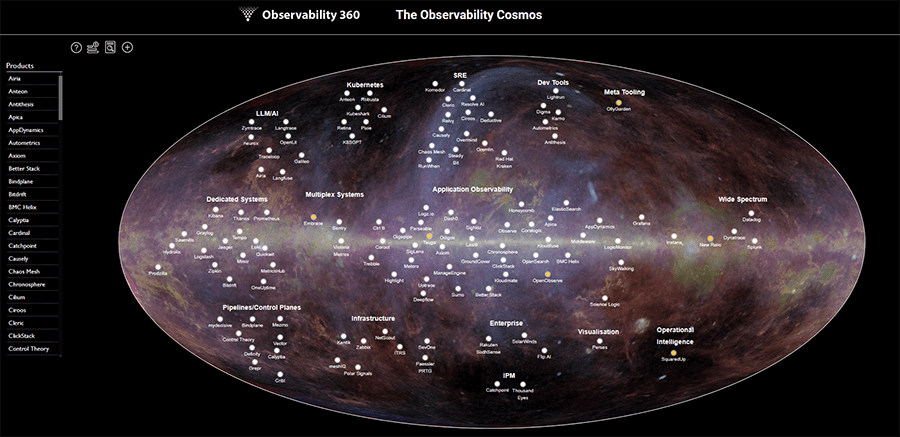
For a long time I have had an itch to come up with a mapping of the observability space. There are other classifications out there, which I have always enjoyed browsing but I found myself disagreeing with the method or the criteria or the classifications.
The Observability Cosmos is an attempt at defining our own mapping and has been launched on the Observability 360 web site. It includes 126 products across 16 categories. I hope that you find it useful and interesting.
It is in the nature of these projects that there will be different perspectives on categories and placings. For this reason we have defined the launch as a beta - and would love to hear your thoughts before the “full” release. So please feel free to poke it, kick at it, shout at it but above all, let us know what you think. You can explore it here.
Feedback
We love to hear your feedback. Let us know how we are doing at:
NEWS
GrafanaCon - Big Releases and a Strategic New Acquisition

GrafanaCon is normally a high-octane event with lots of announcements, and the 2026 edition did not disappoint. One of the big highlights was the unveiling of Grafana 13. The theme of this release is productivity and it includes a number of improvements to help users build dashboards more quickly.
Grafana have also been busy ramping up their AI observability capabilities and they used the event as the stage for launching the public preview of their AI Observability in Grafana Cloud product. It is described as a complete solution for observing agent behaviour in real time.
Like other vendors, Grafana are also looking at improving the performance of their Log Analytics and this has resulted in the acquisition of Logline to help reduce latency in searches over high-cardinality data.
Aura - Mezmo’s Open Source Agentic AI Play
In edition 44 of the newsletter, we reported on how Edge Delta were using Agentic AI to bring observability to the edge - attempting to identify anomalies from within the telemetry pipeline itself. It seems like this may be a trend rather than a one-off manoeuvre as pipeline powerhouse Mezmo have also made their own agentic play.
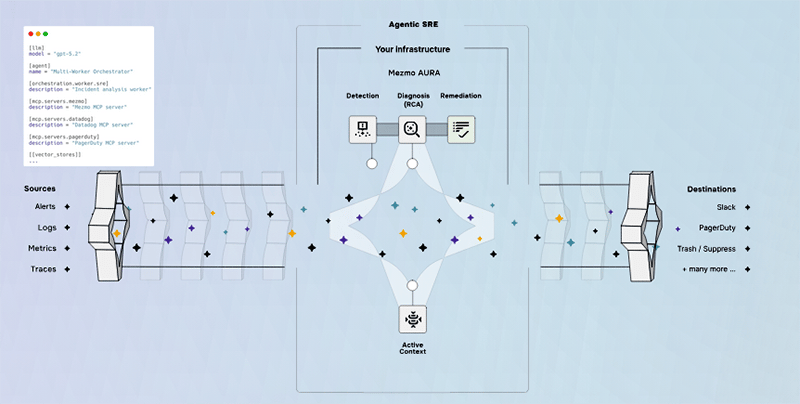
The Mezmo proposition is Aura and it is a different beast altogether to the Edge Delta offering. It is actually an open source framework for hosting and orchestrating agent activities. It is a layer that runs on top of your existing observability provider rather than replacing it. The framework is open, so that you can bring your own MCPs, knowledge base and agents and run them as part of a complete SRE workflow.
From a commercial perspective, the Mezmo vision is that Aura functions as an execution layer on top of Mezmo’s Active Telemetry Pipelines - which function as the data layer. There is a lot to like in this model - running your own agentic workflows over data that has been filtered and enriched by a telemetry pipeline.
Products
Opik - a Control Plane for Agents
With the rapid growth in AI development, major players in the market are now developing frameworks for agent hosting. Anthropic, for example, offer a managed agent service that includes sandboxing, continuity, and granular observability. Unfortunately, these frameworks are expensive at scale and come with the risk of vendor lock-in. You are also limited by the abstractions and assumptions built into the framework.
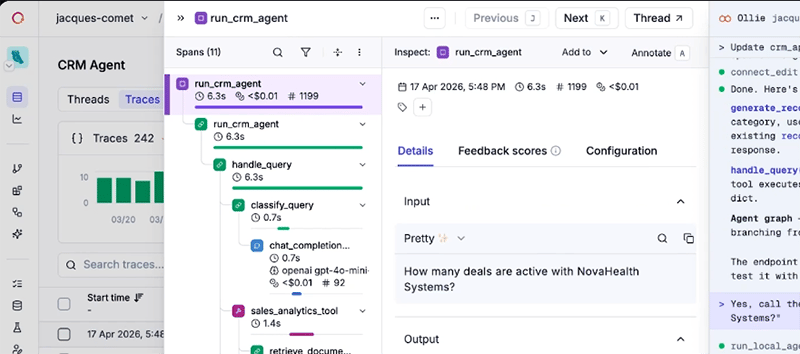
For teams building their own harnesses, Opik has emerged as one of the market leading solutions for specialist Agentic AI observability. It is not solely an observability platform - in fact the company describes the product as an Agent Control Plane. It also includes tooling for assertion-based testing of agent behaviour as well as a coding assistant that applies fixes and optimisations directly to your codebase.
The platform is available as OSS and has 19,000 stars on GitHub.
OpenData Timeseries: Prometheus-compatible Metrics on Object Storage
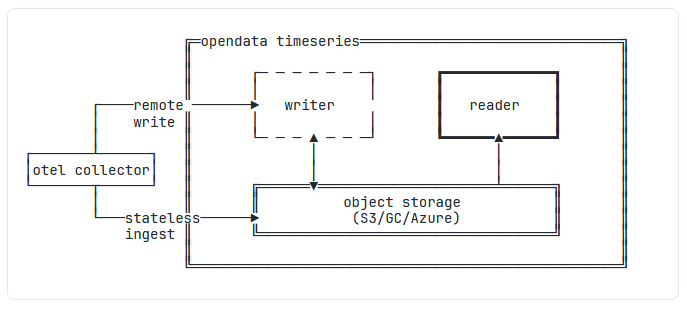
OpenData Timeseries is a new product which aims to bring the advantages of object storage to time series database management. The creators of the system claim that the stateless nature of object storage results in a simplified architecture and dramatic reductions in cost.
According to the article on the OpenData blog, a single node with 4 vCPUs and 16GB of RAM can ingest 55k samples/sec, or 4.7B samples/day. Equally, since object storage is already replicated internally, you don’t need to pay the “double tax” of replication across availability zones. They estimate that this would result in a total monthly cost of around $560 - compared to $12,830 on Amazon Managed Prometheus and $9,897 on Grafana Cloud Enterprise.
Obviously, a comparison between a self-hosted instance and a managed service is not exactly like-for-like. A comparison with a Prometheus or VictoriaMetrics instance might be more appropriate. Still, on the basis of our own back-of-an-envelope calculations, OpenData is a highly competitive offering.
From the Blogosphere
How Strikeready Improved Performance While Reducing Infra by 80%
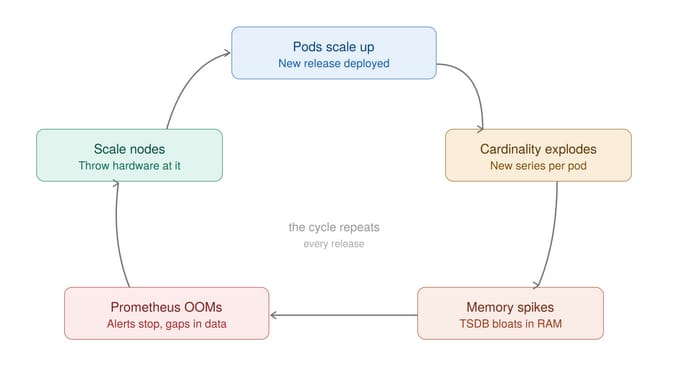
This article by Faizan Tallat of Strikeready is a really great example of how throwing more hardware at a performance problem is not always the right solution.
His team found themselves locked in a cycle of OOMs and hardware scaleups as every new release left their Prometheus instances thrashing. Digging deeper they realised that the source of the problem was the tight coupling of concerns within the Prometheus binary, where spikes in the scraping layer drained resources from the storage layer.
Rather than scaling up their hardware, they undertook a re-think of their software architecture, transitioning to a pipeline model using VictoriaMetrics vmagent and VMSingle deployments to manage different workloads and scale independently.
The results were spectacular - across 30 Kubernetes clusters, vCPU usage dropped from 76 vCPUs to 16 and RAM consumption plummeted from 368GB to 50GB.
AI
Dash0 Skills - Become an Instrumentation Ninja
There has been a lot of coverage of the observability cost crisis, what is often overlooked though, is the observability knowledge deficit. Not every company has a specialist observability team and many skilled and experienced platform engineers don't have the bandwidth to get deep into the weeds of Baggage and Semantic Conventions.
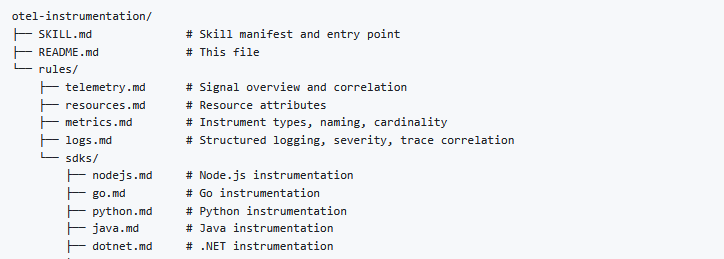
Luckily, there are an increasing number of tools and resources that can help teams to bridge the gap. A shining example is this repo, created by Michele Mancioppi - Chief Architect at Dash0.
This is a set of rules and skills that you can install into your coding assistant to build enterprise quality instrumentation into your code. It covers every major language and runtime and the level of detail and expertise is exceptional. As well as instrumentation, the skills also cover areas such as Semantic Conventions, OpenTelemetry Transformation Language and oTel Collector configuration.
If you are like me, you are probably suffering from AI recommendation fatigue. Every day there is a new must-have repo. This one, however, definitely deserves a place in your telemetry toolkit.
Through the Wormhole - Observability in a Post-AI World

The AI revolution is so profound and is moving so fast that attempting to predict its impact can seem hopeless. It feels a little like we are huddled in Plato’s cave, watching as the shadows flicker on the wall. At the same time though, it is impossible to resist the urge to get some bearings and identify trends and trajectories.
This article on the Observability 360 web site looks at a number of emerging trends and debates - the explosive rise of AI SRE, the compression of the classic SDLC, the “death of SaaS”, the discovery of observability’s “dark matter” and attempts to figure out what observability might look like when it emerges at the other side of the AI wormhole.
OpenTelemetry
Despatches From the Trenches - Skyscanner’s oTel Rollout
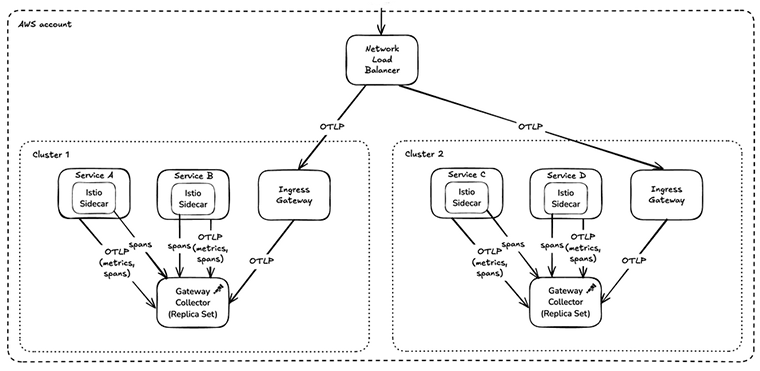
The difference between theory and practice is, as they say, much bigger in practice than it is in theory. This particularly applies when you start to think about all of the design and architectural issues for rolling out OpenTelemetry in your enterprise.
Skyscanner is a global travel platform running 1,000 microservices across 24 production Kubernetes clusters. This article is a summary of their oTel rollout and provides a lot of great insights from the trenches. The way in which the platform team use Istio span metrics to avoid overloading Prometheus is a brilliant piece of engineering.
This is actually one of a series of articles being published by the OpenTelemetry Developer Experience Special Interest Group. The series aims to share insights and lessons learned from a range of companies and also includes articles on OpenTelemetry rollouts at Adobe and Mastodon.
Coralogix OBI - The End of Manual Instrumentation?
OBI is the OpenTelemetry initiative to harness the power of eBPF so that instrumentation becomes a platform concern rather than a developer concern. Declaring that it means the end of manual instrumentation is a pretty bold flex. Despite the dramatic headline, this article does provide a useful summary of the potential of OBI to reduce toil.
As the article notes, ”OBI delivers a powerful observability layer with a minimal system footprint”. This includes benefits such as Automatic Service Discovery, Encrypted traffic visibility and Request context enrichment.
Arguably, though, this does not tell the whole story. It is likely that many teams will take a more layered approach, using manual instrumentation and SDKs for deep code-level spans and stack traces for more advanced diagnostics.
Video
Getting a Handle on Your oTel Baggage
This is a video of an Observability Day presentation by Dan Gomez Blanco of New Relic and John Clark of Skyscanner, which takes a deep dive into the OpenTelemetry Baggage signal.
Their perspective is that Baggage is maybe a signal that doesn’t necessarily get the recognition it deserves. Despite being a humble key-value store, it can be used for more than propagating values such as a tenant_id from one service to another.
As John Clark explains, the team at Skyscanner exploited the capabilities of Baggage to overcome a major limitation in the Istio service mesh when attempting to apply Quality of Service logic. There is a lot to unpack in this talk!
That’s all for this edition!
If you have friends or colleagues who may be interested in subscribing to the newsletter, then please share this link!
This week’s quote is by Eric Fromm
“Creativity requires the courage to let go of certainties.”
About Observability 360
Hi! I’m John Hayes. As well as publishing the Observability 360 newsletter, I am also an Observability Advocate at SquaredUp.
The Observability 360 newsletter is entirely autonomous. All opinions expressed in the newsletter are my own.