- Observability 360
- Posts
- Lightstep Goes Dark
Lightstep Goes Dark
An OllyGarden Bouquet | Prometheus Burns Bright at PromCon
John Hayes
October 31, 2025
Welcome to Edition #38 of the newsletter!
Observability’s AI Dividend
William Gibson famously commented that the future is here, it’s just not evenly distributed. The same might be said about the benefits of AI. Whilst many businesses cite failed projects and lack of return on investment, the picture in the observability space looks a lot more positive.
In this month’s newsletter we cover AI rollouts by SigNoz and ClickHouse, and they join the ranks of many other vendors who have brought to market AI functionality delivering genuine value for end users. There have been amazing advances in Natural Language Querying and signal correlation.
As we head into 2026 we think that some of the new frontiers will be concerns such as predictive analytics, assisted instrumentation and intelligent configuration diagnostics.
Where do you think AI in observability will go in 2026? Get in touch on one of the channels below, share your thoughts and maybe we will publish them in our end of year review.
Feedback
We love to hear your feedback. Let us know how we are doing at:
NEWS
Prometheus Flame Burns Brightly at Promcon

The major event of this week was probably the annual gathering of the Prometheus community in Munich for this year’s PromCon.
The relationship between OpenTelemetry and Prometheus is always a hot topic and Prometheus co-founder Julius Volz dealt with it in typically bullish tones. He extolled the technical advantages of Prometheus, warned against the trade-offs involved in OpenTelemetry and issued a rallying call to “keep the ecosystem alive and thriving.”
Promcon is very much an event for knowledge-sharing rather than vendor promotion and razzamatazz. There were, however, a couple of noticeable product announcements. The first is that Native Histograms, a feature promising major efficiency gains, is now rated as stable. Secondly, there was the news that he Open Metrics 2.0 specification is now being merged into the Prometheus project.
Full recordings of both days and now available on YouTube. A highlight we are looking forward to delving into is this Day 1 discussion on Prometheus integration with Perses.
Lightstep Being Shuttered by ServiceNow
The observability community was rocked this month by the news that ServiceNow will be shuttering their Cloud Observability (formerly Lightstep) product. Lightstep was acquired by ServiceNow in 2021 and was considered to be one of the finest and most innovative products on the market. It was led by Ben Sigelman, an observability visionary who was part of the team behind the seminal Google paper on distributed tracing.
At the time of its acquisition, ServiceNow hailed Lightstep as a "next-gen observability leader". It is not really possible for us to speculate what might have happened in the meantime but the news prompted heartfelt tributes from many leading figures in the observability space.
The Lightstep announcement was followed in pretty short order by news of a “strategic collaboration” with Dynatrace. According to the company’s press release, the aim is to bring together “real-time, AI powered observability from Dynatrace with ServiceNow’s AI-powered IT Service & Operations Management“.
Dash0 Refuel with Major Cash Boost
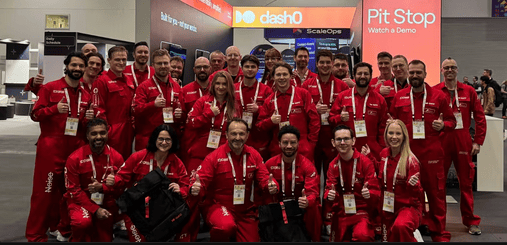
Dash0 seem to be hurtling through the observability space at the speed of Max Verstappen heading down the back straight. The latest news is the announcement that it has raised $35m in a Series A funding round.
Within a year of launching, the company claim to have already signed up over 270 customers - as well as making quite a splash at conferences with their pitstop-themed stand and distinctive red livery.
Judging from the press release, the cash injection will be used to push forward the company’s vision of building an “AI-native observability platform” centred around its Agent0 SRE AI agent.
The Dash0 team have also added to their impressive library of OpenTelemetry documentation with the release of a 60-page OpenTelemetry for dummies e-book, which is available for free download.
Observe Bet on Iceberg to Break Open Data Silos

Credit: Olga Gavrilova / Shutterstock
Observe have established themselves as a big hitter in the petabyte-scale ingestion tier. Underlying this is a data lake architecture with a Snowflake-powered analytics engine. Since data lakes tend to store data in raw rather than proprietary formats, they offer up the possibility of customers being able to access that data with their own tooling. This is a vision that Observe CEO Jeremy Burton sketched out in this recent LinkedIn post.
The enabler for this would Apache Iceberg - which would provide the wiring and control logic for efficient, scalable and robust querying. The theme of leveraging the capabilities of Iceberg was expanded upon in this article by Observe co-founder and Chief Product officer Jacob Leverich. Empowering customers to connect their observability data to other businesses sources is a pretty powerful flex and one that other vendors will undoubtedly adopt.
Products
A New Bouquet from the OllyGarden

It is hardly a state secret that we believe that OllyGarden is one of the most important projects in the observability space. This is because they are at the forefront of solving one of its biggest challenges - improving the quality of telemetry. As in any other system, the GIGO principle applies. Your RoI on your observability system depends significantly on the quality of your telemetry.
In the past few weeks, not one but two new flowers have appeared in the OllyGarden, to form something of an observability bouquet. The first to spring up is Tulip. This consists of a curated and hardened distro of the oTel Collector, backed up by expert support. The distro is free and open source, whilst the support is obviously chargeable.
Sprouting up next to Tulip is Rose. This a flower which is not yet in full bloom but is at the Research Preview stage. It is an actually an agent that integrates into your development workflows and provides feedback on the quality of your telemetry - effectively identifying any thorns that might snag you later on.
OpenLit - Open Source LLM Observability
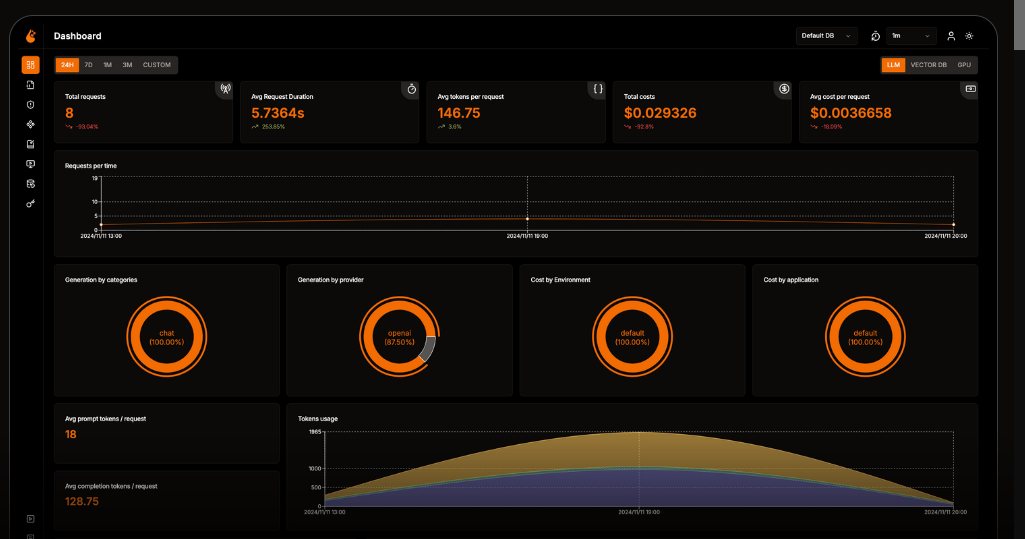
LLM observability is a massively important concern and the market is expanding rapidly. OpenLit describes itself not just as an LLM observability tool but as an open source platform for AI Engineering. From the point of view of AI app development, it supports features such as Secret Management, Guardrails and Model Selection.
In terms of the observability stage of the engineering lifecycle, it is OpenTelemetry-native and, as you would expect, has support for logs, metrics and traces. Those features are probably the baseline, but OpenLit also has other cards up its sleeve such as GPU monitoring and cost tracking. The platform boasts a wide range of integrations, including every major LLM as well as all of the leading Vector DBs and AI frameworks.
Kubernetes
SquaredUp - Getting the Right Angles on your K8S Clusters
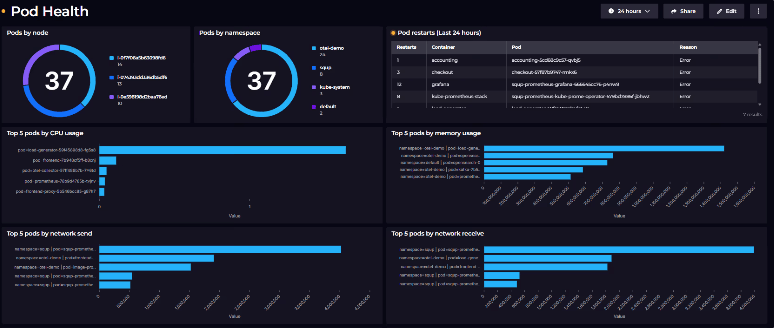
One interesting fact about Kubernetes is that, although configuring and maintaining it can be extremely complex, observing the health of a Kubernetes instance can be surprisingly simple if you have the right tools. In fact, Prometheus metrics and an intuitive visualization tool will do an amazing job.
This is a brief article on how I used the SquaredUp Prometheus plugin to dashboard the vital signs of Kubernetes instance health. Using some reasonably elementary PromQL, it turned out that I could build up a really comprehensive picture of cluster configuration and the state and health of nodes, deployments and pods.
For some of the visualizations I needed to run multiple Prometheus queries and then apply set-based exclusion logic over them. I don’t even know what pyrotechnics this might have required in PromQL, but with the SquaredUp SQL Analytics feature I was able to do this with a simple SQL statement.
Disclaimer: This is about using the SquaredUp Prometheus plugin and I do actually work for SquaredUp.
The Art of Kubernetes Intrusion Detection
If you are an SRE, when an outage happens you will know about it pretty quick. With security breaches the picture is rather less clear as, by their nature, they are designed to go undetected. Intrusion detection therefore is often based on a mixture of tools designed to spot unusual spikes, suspicious patterns or failed logon attempts.
This article by Fatih Koç argues that one of the major difficulties involved in identifying attacks is that of correlating signals across multiple sources such as Falco, Prometheus, Kubernetes Audit Logs etc.
In this article, he outlines a strategy for extracting relevant data from each of these sources and pulling it together into a single observability dashboard. If you know K8S, you will know that audit logs can be incredibly voluminous - meaning not just lots of noise but also some pretty hefty ingestion costs. Helpfully, the article includes a number of scripts for filtering and intelligently aggregating your telemetry.
Security is a relentless arms race and rolling your own solution is not everybody’s cup of tea. At the same time, this article is still a valuable primer into understanding the principles of detection and correlation.
OpenTelemetry
OpenTelemetry Metadata - Mapping the Telemetry Maze
OpenTelemetry is a huge project with a large number of workstreams covering a range of areas such semantics, governance, the oTel SDK and the oTel Collector.
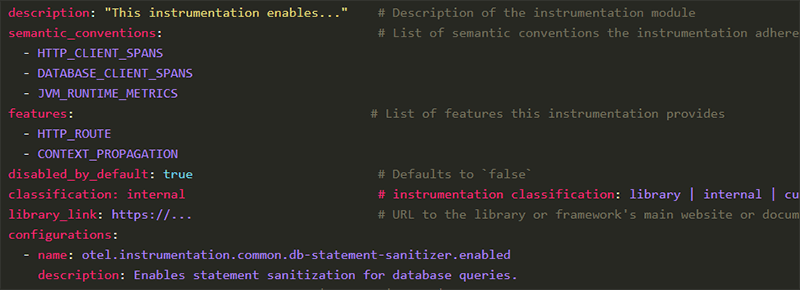
This article by Jay De Luca of Grafana provides a fascinating, behind the scenes glimpse in to the work of developers who contribute to the project (often in their own spare time). Jay is part of a team at Grafana working on building a structured metadata system for instrumentation modules in the OpenTelemetry ecosystem.
This may sound pretty niche but it is a foundational piece of work that will deliver numerous benefits for developers and observabilitity engineers. A great example of its potential benefits is this really cool Ecosystem Explorer, a searchable catalogue of the instrumentation for an entire Java application. This is just a proof of concept but it shows the huge potential of the project for improving discoverability, reliability and consistency across the whole ecosystem.
This is obviously not a trivial undertaking and just getting to the end of Phase One has taken several months of effort. As Jay reflects, this is the type of project that rewards a long-term mindset.
A Milestone for K8S Semantic Conventions
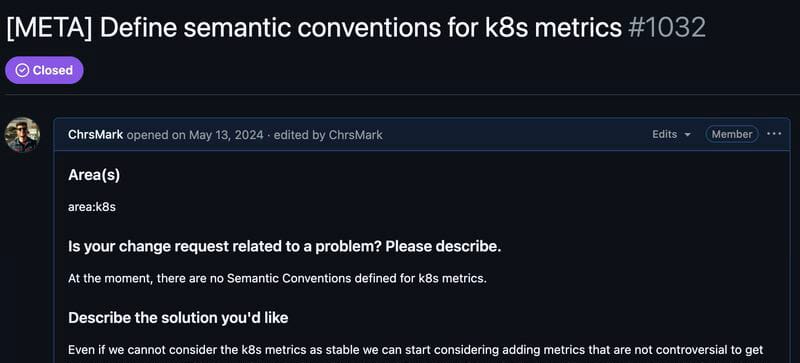
As we all know, naming things is, proverbially, one of the most intractable tasks in computing. Spare a thought then for the Kubernetes Semantic Conventions SIG, who set themselves the not inconsiderable task of of defining semantic conventions for Kubernetes metrics and attributes.
This could easily be a venture that would make the 100 Years War seem like a day at the beach but, commendably the team have successfully closed off the task. As you can imagine, this involved some pretty detailed discussion over questions such as formatting and notation. For example, which of the following is better - k8s.pod.cpu_request_utilization or k8s.pod.cpu.request_utilization.
As SIG member Christos Markou notes in this LinkedIn post, now that the initial PR has been closed the next steps are stabilization and GA. You can follow their progress on this Github board.
You can find a full spec for the conventions on this page on the oTel web site. It may not be James Joyce but it is a great exemplar of formal elegance and clarity.
AI
SigNoz MCP Server - Natural Language Querying for Everyone
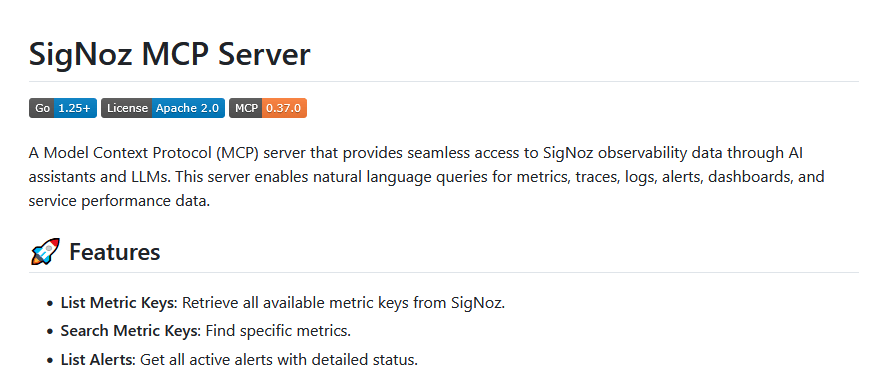
Life comes at you pretty fast. A year ago, MCP was just a glint in the Anthropic’s eye - now it is everywhere. Looking at the recently-released SigNoz MCP server really made us stop and think about how far we have come.
Not so long ago, the notion of being able to ask your observability system a natural language question such as “Show me error logs for the paymentservice from the last hour" seemed like a distant prospect. Now, in systems such as SigNoz it is a function that is available to to everybody as free open source software.
The SigNoz MCP server is compatible with clients such as Cursor and Claude Desktop and, once you have connected, it actually offers a comprehensive set of functions for bringing telemetry from the SigNoz backend straight into your IDE. In keeping with the SigNoz philosophy, the MCP server itself is also open source.
Agents of Change - ClickHouse Unveil AI Tooling
ClickHouse have been innovating rapidly across a number of fronts, and they too have recently rolled their own AI functionality in the form of two new components.
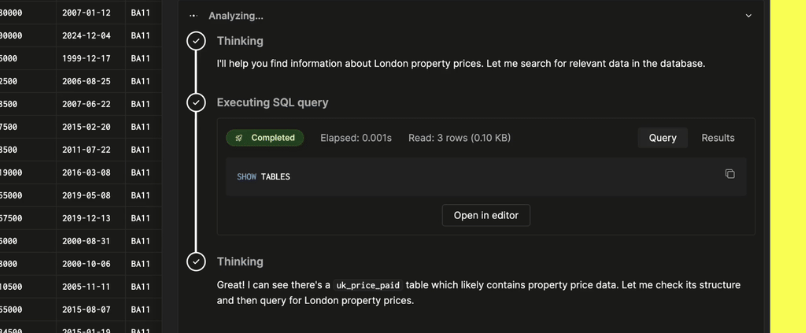
The first is their ASK AI agent, an embedded assistant that runs in the ClickHouse Cloud console. This is a really powerful natural language querying tool that will perform analytics on any dataset - not just telemetry data. In an introductory video on the ClickHouse web site, a user asks open-ended questions about a property prices data set. As a bonus, ASK has also been trained on the ClickHouse documentation, so that you can also ask questions such as “How do I configure materialized views?“
The second component is the ClickHouse Remote MCP server. For some time now, ClickHouse have been championing the notion of “Agent-facing analytics”. This is founded on the assumption that, in the AI age, most of the queries on your database will be made by AI agents rather than humans. For ClickHouse, therefore, their Remote MCP Server is a gateway for facilitating these semi-autonomous interactions between agent and database.
That’s all for this edition!
If you have friends or colleagues who may be interested in subscribing to the newsletter, then please share this link!
This month’s quote is from Steve Jobs:
“Creativity is just connecting things”
About Observability 360
Hi! I’m John Hayes - I’m an observability specialist and I publish the Observability 360 newsletter. I am also a Product Marketing Manager at SquaredUp.
The Observability 360 newsletter is an entirely autonomous and independent entity. All opinions expressed in the newsletter are my own.