- Observability 360
- Posts
- Production World Models
Welcome to Edition #45 of the newsletter!
Context, context, context
In our last edition, we spoke of total context and the value of going beyond the classic three signals to achieve true visibility and understanding of production systems. This is a theme which again figures strongly in this edition. Both Traversal and Player Zero use the term ‘Production World Model’ to describe the multi-dimensional digital mapping that their products construct for extrapolating meaning from an ocean of signals.
The Rise of the oTel Tooling Layer
A rough measure of the growth of a technology can be the size of the ecosystem that springs up around it. A year or so ago we remarked on the apparent dearth of third party tools for OpenTelemetry. Recently though, there has been something of a growth spurt. In this edition we feature OpenTelemetry Blueprints, but it is well worth also taking a trip to the OpenTelemetry Registry, which now lists over 1,000 projects and utilities.
Observability Comes At You Pretty Fast
One of the stories we cover in this newsletter is a talk between Dotan Horovits and Andy Keller of BindPlane on all things OpAmp. When we started writing the newsletter, BindPlane were an independent company. Before we had the chance to hit the Publish button, we saw this post announcing that BindPlane are now to be acquired by Dynatrace. It is a smart move by Dynatrace - BindPlane is a great product. Hopefully though, Dynatrace’s gain does not turn out to be a loss for the open source community.
Feedback
We love to hear your feedback. Let us know how we are doing at:
NEWS
Traversal Introduce Their Production World Model

The AI SRE space is a hotbed of innovation as well as being an ultra-competitive market sector. A major advantage of agents is their ability to analyse huge quantities of data and quickly find correlations. However, that is not enough to provide accurate root cause analysis and recommend remediations.
Agents have to learn. They also need to contextualise all kinds of structured and unstructured data in order to be able to reason over telemetry and alerts. The big question is how do you actually build that context? How do you distil rules, process and meaning from a blizzard of data points?
Traversal have recently rolled out their own AI SRE product, built on top of their Production World Model, a “continuously updated, machine-readable model of your entire production environment“. The analogy they use is that of an autonomous motor vehicle. It does not just rely on the raw telemetry of a camera feed. Instead, it builds up a complete picture of the road around it.
Lumi - the First Observability Warehouse
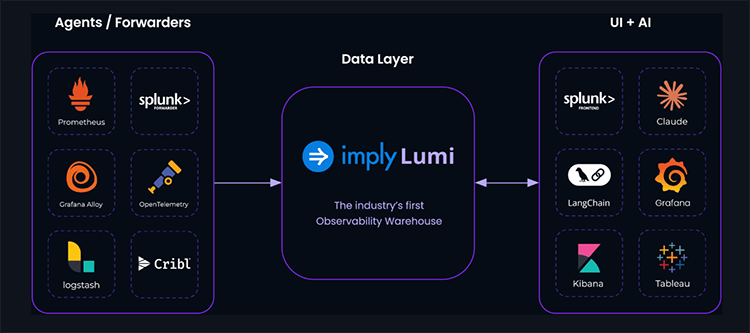
The concept of a data warehouse may not be new, but Imply are branding their Lumi product as the industry’s first observability warehouse. So, what is it and how does it work? Well, it does not replace your existing observability stack. Instead, just like a classic data warehouse, it is a storage location where you can offload data for analysis.
The value proposition lies in the speed, scale and cost savings the system offers. One of the case studies they cite is Roblox - who ingest 86TB daily and use Lumi to run sub-second queries over high-cardinality data.
The system can ingest from sources such as Prometheus, Cribl and Logstash and can be queried by a range of backends including Grafana, Splunk, Langchain and more.
PlayerZero - Letting You Know If That PR Will Break Production
The AI revolution opens up many new possibilities for observability - not least an ever greater capability not just to identify incidents, but to actually prevent them.
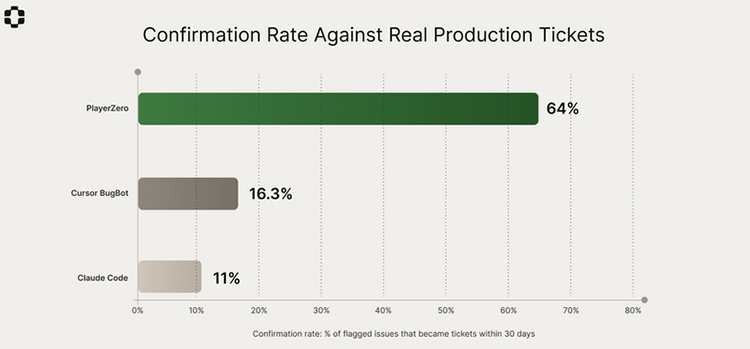
PlayerZero describes itself as “an AI production engineer that builds a living model of how your software actually works”. The company behind the product have recently published the results of a benchmarking study designed to measure the system’s ability to predict whether a given PR will result in a production ticket being raised within the next 30 days.
The findings show that PlayerZero achieved a 64% success rate over a sample of more than 26,000 PRs. This may not sound too reassuring, but it does compare very favourably with other models such as Claude and Cursor’s BugBot.
The benchmarking spanned 3614 repositories, representing approximately 30 billion lines of code. Once again, the key differentiator was context. Whereas other models looked at diffs and compared them with known bugs, the PlayerZero engine builds a production model drawing on a multiplicity of sources.
As well as the benchmarks, the study also throws up more general insights about the most likely causes of failures as well as some interesting statistical findings. For example, deploying more than 6 PRs to overlapping services within 24 hours increased the regression rate more than fourfold.
Datadog Experiments - Ship With Confidence
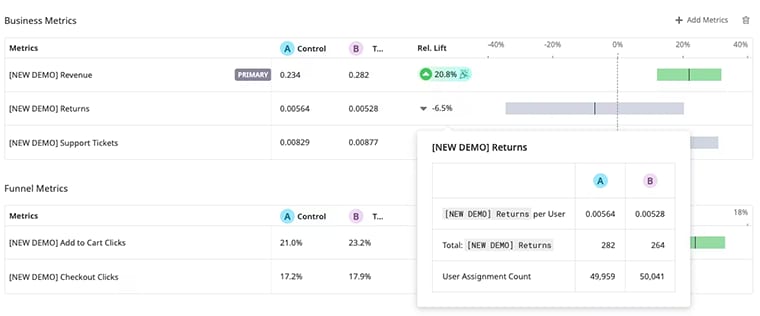
Improving the RoI for observability spend is an important objective for many businesses. One way of achieving this is by aligning observability tooling with business needs. This is a goal that Datadog are addressing with the rollout of Experiments, a feature designed to help users understand the business impact of AI-driven changes.
This means that teams can run A/B tests and measure outcomes across a number of signals including RUM, product analytics, APM and logs. This data can then be correlated with metrics from a customer’s data warehouse to evaluate impacts in areas such as sales revenue or product return rates. The rationale behind the product is that AI is enabling enterprises to ship more software faster and builders need both guardrails as well as real-time feedback.
From the Blogosphere
Outgunning the “three villains” of agentic observability (Sponsored)

As telemetry volumes have exploded, workarounds such as retention limits, sampling, and rollups have come to be accepted as best practices. This post on the ClickHouse blog argues that the inherent scalability of columnar architectures makes these trade-offs unnecessary.
It explores how these constraints place limits on agent-driven workflows, removing vital context and resulting in a degradation of agentic observability.
Mission Impossible? Delivering Reliability Through the Air Gap
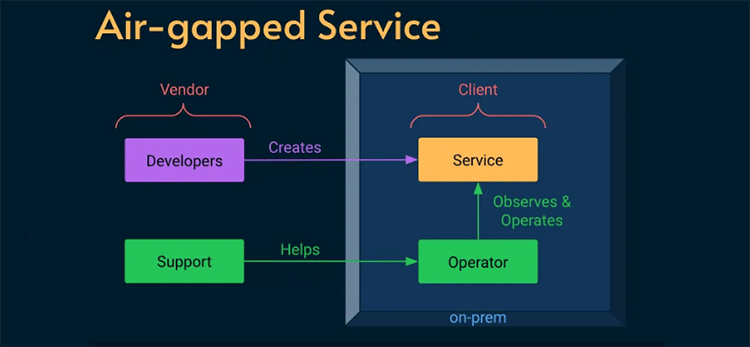
The excellent Alex Ewerlöf blog is now back in full swing and in this latest article he turns his attention to dealing with a real SRE curveball - how to build reliability engineering for an air-gapped system. We are talking hermetically sealed - not even a maintenance window for external connectivity. This task involved a high-security military facility where installing updates meant physically handing over an archive file to a system operator.
The constraints were pretty stringent - no logs, no metrics, no traces, no remote access of any kind.This was an extreme case and, ultimately, the solutions had to be both human-centred as well as relatively low-tech. How would you address the challenge? Hit the link below to read about the solution that Alex put in place.
Products
Getting Productive With Sloth 🦥
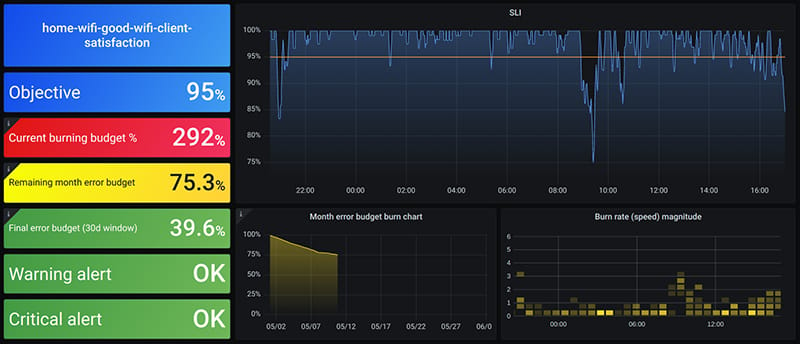
In their new book on Observability in the AI-Native Age, Hilliary Lipsig et al cite instances of teams asking questions such as “How do we set up 10,000 custom Service-Level Objective alerts”. If your team needs to create Prometheus SLOs in bulk, then Sloth might just save you some toil.
Sloth is an open source tool that is under active development and has racked up 2.4k stars on GitHub. You define your outputs using a YAML specification and then use the Sloth CLI to generate Prometheus SLOs. Sloth takes care of all the fine detail such as spec validation, SLI recording rules and multi window multi burn alert rules.
OpenTelemetry Blueprints - an Open Source YAML Generator
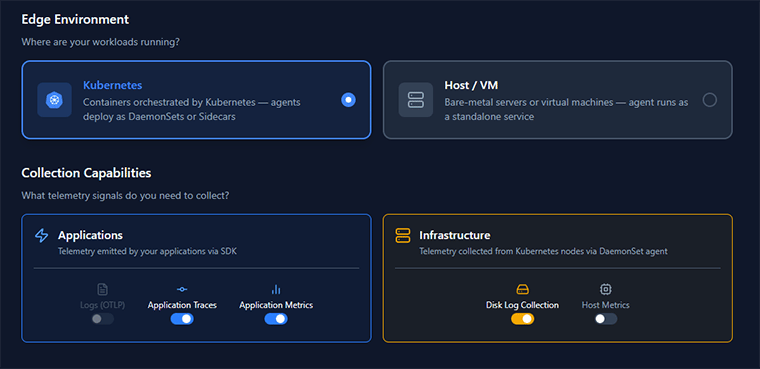
Building an OpenTelemetry Collector config from scratch can be a daunting prospect. There are plenty of samples around but finding a template that fits your use case can be a wild goose chase.
Miguel Luna has come up with this handy OpenTelemetry Blueprints tool to help you reduce the toil. This is a configuration builder where you select from a number of pre-defined options to generate a YAML definition that matches your environment and the kinds of signals you want to collect. It doesn’t cover a number of advanced scenarios and it is not intended to be a complete specification, nevertheless it gives you a solid foundation to build on.
A useful complement to this would be Carl-Magnus Holmström’s oTelStarter tool, which takes you through a similar process for generating instrumentation code for your apps.
OpenTelemetry
Profiles - the Fourth OpenTelemetry Signal
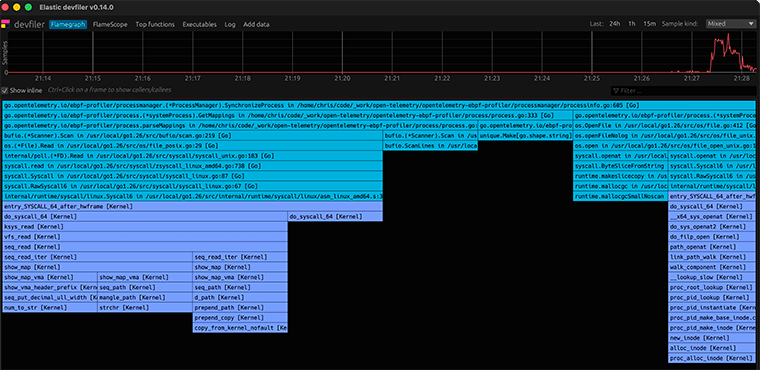
It has been a long time coming but it has finally happened - OpenTelemetry Profiles have entered Public Alpha. The announcement is the culmination of a process which was kicked off as long ago as 2022, with the creation of the Profiling SIG. The next major milestone was the 2024 announcement of formal support for Profiling
What problem is it trying to solve? Profiling is not a new practice, and has been around in one form or another for over 20 years. However, there has never been an industry standard or common format for profiling data.
How will it work? Context is at the heart of the oTel philosophy - so Profiles will not exist in a vacuum. The intent is that Profiles will integrate closely with other signals - so that you can link a spike in CPU or an Out of Memory log entry to a specific block of code.
What is the current status? The signal is still under development but the oTel Collector now includes support for receiving Profiles. There is also an eBPF Profiler - although it currently only supports Linux.
Andy Keller Talks OpAmp With Dotan Horovits
If you are using the OpenTelemetry Collector at scale then Fleet Management is an essential part of your toolkit. Andy Keller is Principal Engineer at pipeline specialists BindPlane as well as being a maintainer for OpAmp - the protocol for managing telemetry agents.
This interview with Dotan Horovits is a really informative dive into the technology and how it is used. Whilst orchestration and configuration are initial concerns, monitoring health and performance is also essential for critical production environments.
What is also perhaps surprising is the variety of hosting options. Kubernetes deployment may be the most common pattern but out in the wild companies are also running thousands of collectors embedded in IoT and Point of Sale systems.
AI
Microsoft Foundry Gets an Observability GlowUp
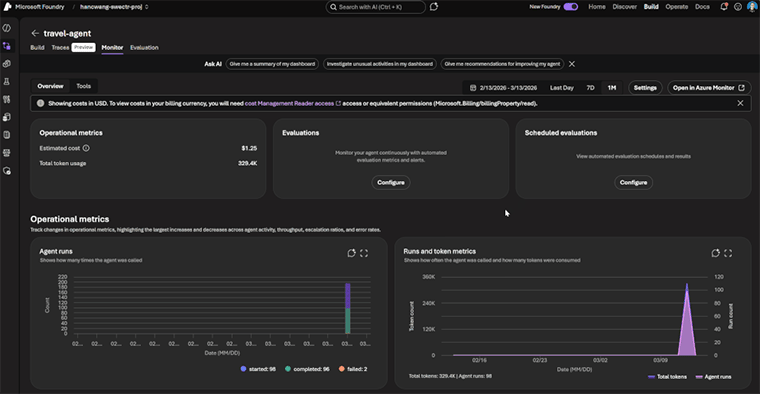
Microsoft have announced a major observability tooling upgrade for their Foundry AI platform with the rollout of new capabilities for Evaluations, Monitoring and Tracing.
As Sebastian Kohlmeier points out in the release article, “point-in-time” is an approach that does not work for AI agents. Production behaviour is volatile, which means that evaluation needs to be continuous. Foundry now ships with a set of built-in evaluators designed to run at every stage of the AI lifecycle. In addition, users can also build their own custom evaluators.
Because of the nature of Agentic AI systems, traces need to do a lot more than propagate context across service boundaries. Tracing in Foundry, therefore captures vital context such as tool invocations, orchestration logic and responses and parameters for tool calls.
If you are using the Azure Cloud, this article by Microsoft MVP David Rendon provides a really detailed summary of the latest AI capabilities for Azure Monitor.
That’s all for this edition!
If you have friends or colleagues who may be interested in subscribing to the newsletter, then please share this link!
This week’s quote is from American astronomer Vera Rubin
“The most important feature of any telescope is the imagination with which it is used.”
About Observability 360
Hi! I’m John Hayes. As well as publishing the Observability 360 newsletter, I am also an Observability Advocate at SquaredUp.
The Observability 360 newsletter is a entirely autonomous. All opinions expressed in the newsletter are my own.