- Observability 360
- Posts
- Sentry's AI Powerplay
Welcome to Edition #37 of the newsletter!
Hi! We are back after our summer break, and we are also celebrating our second birthday!
The first edition of the newsletter was published in September 2023. As we enter our third year, there seems to be no let-up in the growth and dynamism in the observability space. Despite speculation that the bubble will burst, we have seen major new players such as Dash0 and ClickHouse surging into the market.
What is also of note is the trend towards expansion, where existing point vendors and specialists evolve towards becoming full stack providers. Two of the products featured this month are great exemplars of this trend, with Embrace and Sentry both branching out in new directions. This is a fascinating trend and one which continues to put pressure on the top tier vendors. The game is heating up.
Feedback
We love to hear your feedback. Let us know how we are doing at:
NEWS
Sentry’s AI Powerplay

Sentry have long been one of the leading players in the developer observability market and have recently spread their wings with the rollout of a dedicated metrics platform, as well as adding support for log aggregation. They have kept up the momentum with the recent launch of a highly impressive set of AI capabilities. This consists of a number of elements including an MCP Server, MCP Server Monitoring and Agentic AI Monitoring.
Creating an MCP Server may not be news these days - they now seem to be almost ubiquitous. Unlike many others though, the Sentry MCP server seems like a genuine value-add. It gives developers rich context on runtime issues right from their development IDE. It has proved hugely popular with users and is now receiving upwards of 50m requests per month.
The MCP Server Monitor actually started life an as internal tool to monitor the Sentry MCP Server, and, having battle tested it on their own software, the company have now released it as a tool in its own right. The monitor uses a server-side Javascript SDK and provides analytics on traffic and requests as well visibility on key metrics such as performance and error rates.
Whilst the challenge of MCP monitoring arguably lies in dealing with the breakneck pace of change, AI Agent monitoring represents a different kind of challenge. Agentic flows can be highly dynamic with dynamic routing permutations and diverse payloads. Agentic processes are not linear, they involve orchestration across multiple boundaries. The Sentry solution aims to provide end-to-end coverage from the user input throught to the backend API and then the agentic chain.
Perses - The legend grows
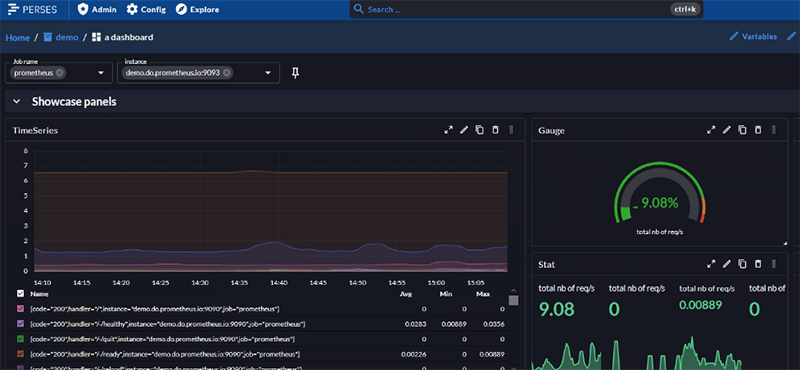
The Perses project set out with the highly ambitious goal of creating an open source Dashboarding as Code platform. Most people might baulk at the prospect of taking on Grafana on their own territory but, after steadily building a foundation, the project is now progressing in leaps and bounds.
The latest release of the project includes a slew of new features, including very slick implementation of log visualisation. There are also two new Continuous Profiling plugins, one for connecting to a Pyroscope server and one for creating Flame Chart visualizations.
For our money, this is one of the most exciting open source observability projects at the moment and, of course, being a CNCF project, the software is safeguarded for the community for the long term.
A Dash of RUM

Dash0 have made a huge impression on the observability market since their launch last September and they continue to push on at a breathless pace.
They have now joined the growing list of vendors to roll out RUM functionality, with the release of their Website Monitoring feature. Like many such features it tracks the Core Web Vitals such as LCP (Last Contentful paint) and CLS (Cumulative layout Shift) but also packs in quite a bit more.
As you would expect, it provides metrics for events such as http requests and responses and page loads. In addition, it also captures session data to build up a picture of the user’s journey through your site or application. As Dash0 is a full stack product, it is also able to provide an end-to-end view of each user interaction and correlate frontend and backend calls.
Embrace User Journeys - Taking RUM to the Next Level

It is remarkable how RUM has established itself as a first class observability citizen within a relatively short space of time. Having recently rolled out their own RUM product, Embrace have now ratcheted things up a notch with the the release of their User Journeys feature.
The obvious question is “How does this differ from RUM?”. Well, whereas RUM has traditionally defined the user experience purely in terms of metrics such as page load times or core web vitals, User Journey Mapping attempts to pull together a whole range of signals to gain a deeper understanding of user behaviours - i.e. how did page load time actually affect the user’s behaviour. User Flows also enable engineers to segment user interactions along arbitrary start and end end points. These segmented behaviours can then be correlated with specific outcomes.
Having been confined to the server room for so long, observability has truly broken out into the front end in recent times, and this is a really clear example of that trend. More and more vendors are seeking to offer an end to end view of user interactions and pushing into an area traditionally the preserve of specialist marketing products is a really interesting development. This also aligns with the stance taken by vendors such as SquaredUp - who place observability within the context of a wider Operational Intelligence vision.
Splunk rock on at .conf2025

Splunk’s .conf is one of the biggest single-vendor events on the observability calendar. This year’s iteration took place in Boston, attracting 6,000 attendees and even featured a set from 90s powerpop icons Weezer.
Obviously, the tech was centre stage and the Splunk team rocked the house with some pretty big hits of their own. Unsurprisingly, AI was front and centre and, being Splunk, the approach is very much data-driven. A whole raft of innovations were announced, spanning four main themes - alert management, troubleshooting, LLM observability and unified observability.
Event iQ is Splunk’s solution for alert fatigue. It attempts to correlate alerts into a single ‘episode’. The Episode Summarizer then uses AI to gather together all the relevant context for the episode. Next up are AI Troubleshooting Agents - which aim to provide root cause analysis for outages in distributed systems.
For AI observability, Splunk have taken a two-pronged approach. First up is AI Infrastructure Monitoring which, as the name suggests, provides insights into GPU/CPU performance and resource allocation. For LLM and agentic AI observability the solution is AI Agent Monitoring.
Unified Observability is becoming an increasingly salient theme for wide-spectrum vendors and the Splunk answer to this is Business Insights - a tool which aims to align observability insights with business goals.
Splunk is a gargantuan beast with many many tentacles so it is not possible to cover all of the news here, so check out the link below for more details.
Products
Netscout - from DialUp to DDOS Mitigation

Normally in this section we look at products which are newly released or in beta. That is certainly not a category that NetScout fall into - in fact, they can trace their pedigree all the way back to 1984 - the days of X.25, AppleTalk and Dial-Up. It is probably fair to say that they were one of the pioneers of networking observability.
This is a domain which is often overlooked in a time when observability narratives are dominated by discussions around microservices, oTel and Kubernetes. However, as times have changed, so have the challenges in networking monitoring. Although massive DDoS strikes such as the 37.4TB attack on Cloudflare earlier this year may grab the headlines, DDoS attacks are a risk to businesses of all sizes. NetScout has its own DDoS mitigation tool (Arbor) and was recently named a leader in the DDoS mitigation field.
Although securing the perimeter is a top priority, there are also many more demands on networking tools. nGeniusONE is billed as NetScout’s solution for “network observability”. Its a solution that shows that networking observability is not just about routing stability and packet loss. The game has moved on and concerns such as performance analysis, Dependency Mapping and Synthetic Testing figure prominently.
Uptrace

Uptrace is one of the new breed of vendors building streamlined, low-cost systems based around OpenTelemetry. Despite the name, this is a full-stack system, and the company position themselves as a low-cost alternative to top-tier vendors such as New Relic and Datadog. For $400 per month you can ingest 3TG of logs and traces and 200k metric time series. Although this compares favourably with other vendors on price, the trade-off is a more limited feature set.
The product comes in a number of flavours. As well as a SaaS version, you can also opt for an on-premise license if you want to keep your data on-site. The software is also open source and the GitHub project currently has approaching 4,000 stars.
From the Blogosphere
Andrew Mallaband - Observability 2025 Series

Andrew Mallaband is one of the most influential voices in the observability space. He has deep experience in the trenches through working at Turbonomic and has also assisted many companies with their GTM strategy . He is also highly respected as a consultant and author on business growth and positioning.
Over the course of this year, he has embarked on publishing a series of in-depth studies of the observability market. The series covers a wide range of themes including cost management, data pipelines, observability strategy and AI to name a few.
These are not three minute blog articles. Andrew describes the work as 'analyst grade' studies. They are designed for a long read over a coffee. Andrew has now collected the whole series together into a single directory for easy reference. Grab yourself a flat white and click on the button below to dig in!
How Grafana Use a Canary to Fight Intruders
The first line of cyber defence is normally at the perimeter - preventing attackers from entering your network in the first place. The next line of defence is intrusion detection. This can often take the form of anomaly detection using a variety of heuristics.
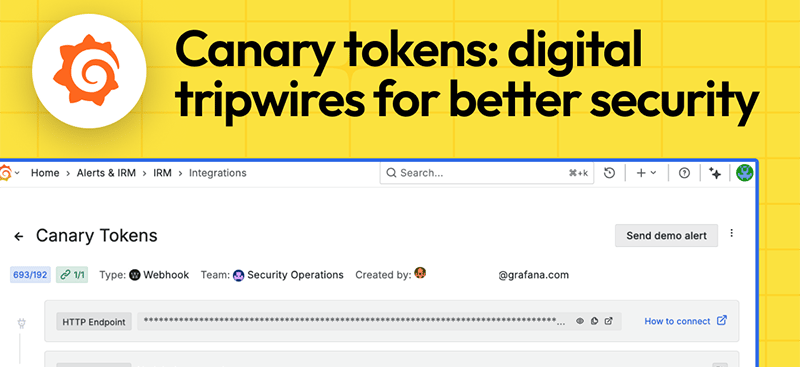
There are also some more creative possibilities, such as the canary solution adopted by Grafana. Just as the canary in the coalmine sings to alert underground workers to the presence of toxic gases, Grafana’s canary was designed to alert them to the possible presence of intruders in their domain.
How did it work? Well, as this article on the Grafana blog relates, it involved the laying of digital tripwires which an intruder might trigger in an attempt to escalate system privileges. This is actually not just a hypothetical piece - it is made all the more relevant by the fact that it actually helped to alert Grafana engineers to a real life attack on one of their servers earlier this year. Naturally, cybersecurity is a never ending game of cat and mouse - and as we have seen in real life - the mouse may evolve to get wise to the bait, but this is also a really enjoyable dispatch from the front line.
OpenTelemetry
Making your oTel Collector highly available

As the OpenTelemetry Collector establishes itself at the heart of observability architectures, the question has shifted from whether to use it to how to use it. One of the most critical challenges is resilience. There are all sorts of error conditions which might impact an oTel Collector, and if it goes down you are left with zero visibility of your backend applications.
Bindplane are one of the leaders in the burgeoning oTel Pipeline sector and in this blog article Adnan Rahic provides a comprehensive step-by-step guide to building high availability for your oTel pipelines. The tutorial shows how you can use BindPlane to adopt the Agent-Gateway deployment pattern.
This si a strategy which involves using oTel collectors in different modes at different layers in your architecture. Firstly, collectors run as agents on individual hosts and forward telemetry to a second layer of Collectors which act as gateways that run filtering and transformation before forwarding on to your telemetry backend. This is a detailed and in-depth article that comprehensively covers the technical challenges in implementing this pattern in your production environments.
To Sample Or Not To Sample

One of the fault lines in contemporary observability is between those who advocate ingesting everything and those who advocate being selective. If you are highly risk-averse or have deep pockets the first choice might make sense. The second will appeal if you have more of an eye on your budget.
The people at OneUptime would appear to fall very much within the latter camp and this article on their blog is a practical guide to how you can reduce the noise (and your observability bills).
They lead with the argument that 95% of incident resolution depends on just 5% of your telemetry. They therefore advocate keeping 100% of your “golden metrics” whilst being more economical with logs and traces. The fundamental principle is not to work on the basis of arbitrary numerical targets but to work backwards from desired observability outcomes and regularly review the value of the telemetry you are collecting.
That’s all for this edition!
If you have friends or colleagues who may be interested in subscribing to the newsletter, then please share this link!
This month’s quote is from mathematician and physicist Henri Poincaré
“It is through science that we prove, but through intuition that we discover”
About Observability 360
Hi! I’m John Hayes - I’m an observability specialist and I publish the Observability 360 newsletter. I am also a Product Marketing Manager at SquaredUp.
The Observability 360 newsletter is an entirely autonomous and independent entity. All opinions expressed in the newsletter are my own.